Executive Summary
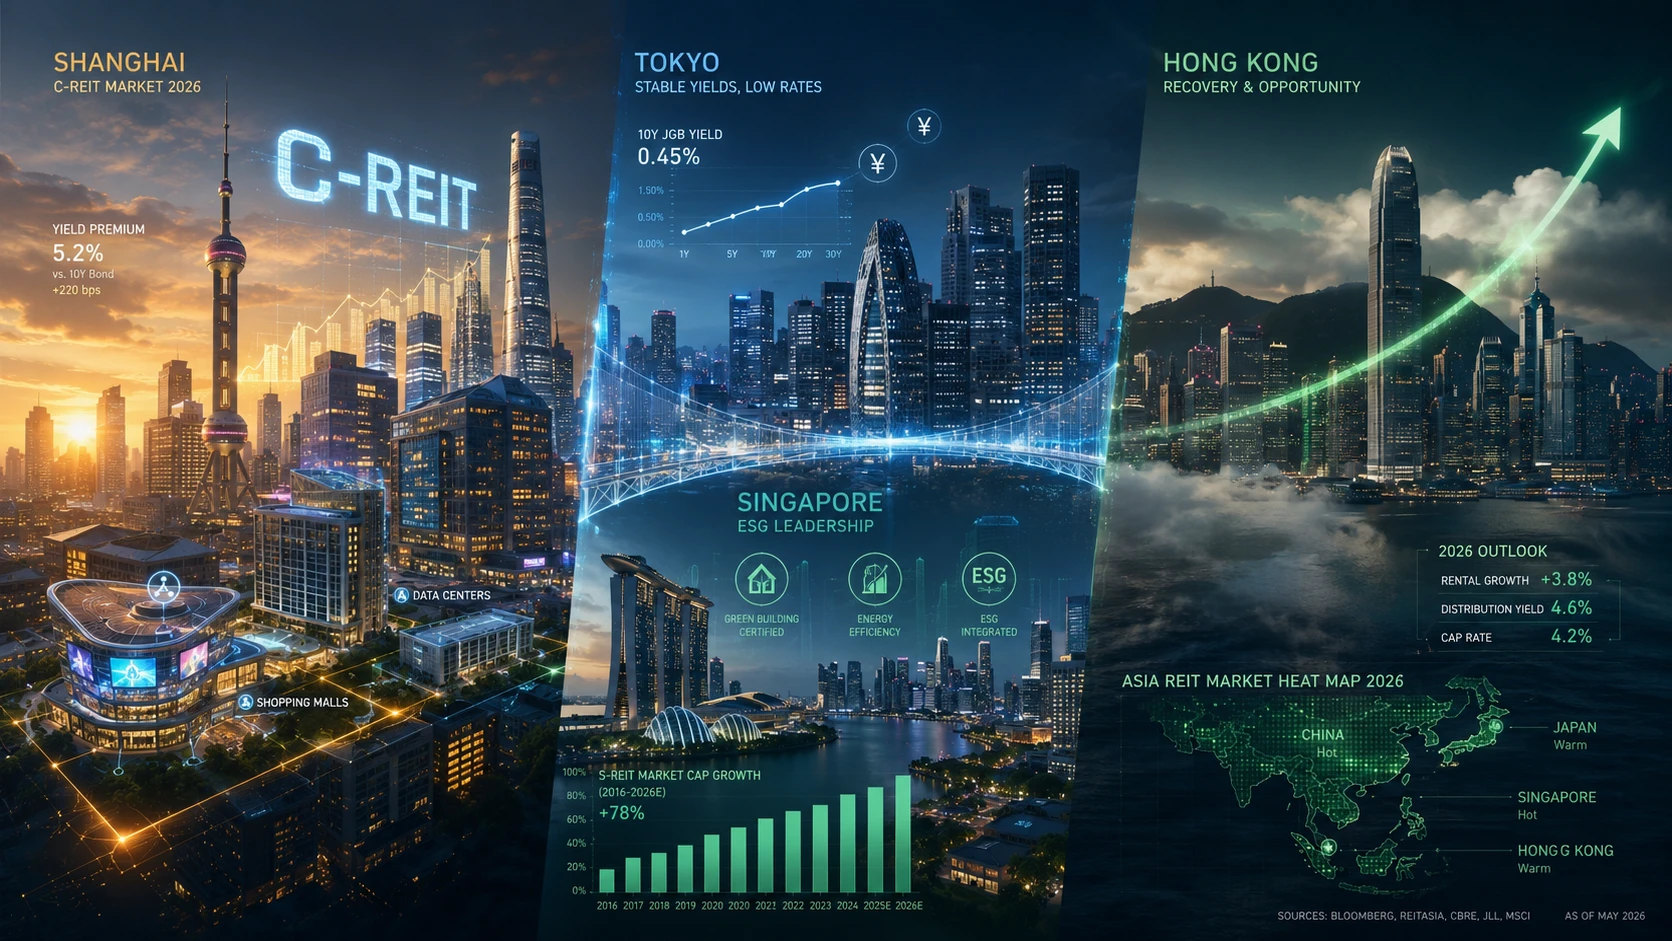
The 2025-2026 fiscal year marks a watershed moment for Asia’s real estate investment trust (REIT) landscape. While Japan’s J-REIT market navigates the turbulence of interest rate normalization and Singapore’s S-REIT sector demonstrates resilience amid global capital rebalancing, the defining story is the official launch of China’s commercial real estate REIT (C-REIT) pilot program — a development that unlocks an estimated RMB 50+ trillion commercial property stockpile for securitization.
Cushman & Wakefield’s latest annual report, spanning 94 pages with over 86,000 Chinese characters, provides the most authoritative cross-market analysis of Asia-Pacific REITs to date. This article distills the report’s key findings into actionable insights for global investors, asset managers, and real estate professionals.
Part I: Japan REITs (J-REITs) — Rate Normalization Stress Test
Market Overview
As of end-2025, the Tokyo Stock Exchange listed 57 J-REITs with a combined market capitalization of approximately ¥14.7 trillion (USD 97.5 billion), representing a decline from the peak of ¥22.2 trillion in 2021. The rate normalization cycle initiated by the Bank of Japan in 2024 has been the dominant macro force reshaping the J-REIT landscape.
Table 1: J-REIT Key Market Metrics (2021-2025)
| Metric | 2021 (Peak) | 2024 | 2025 | YoY Change |
|---|---|---|---|---|
| Number of Listed J-REITs | 63 | 58 | 57 | -1 |
| Market Cap (¥ trillion) | 22.2 | 15.3 | 14.7 | -3.9% |
| Average Dividend Yield (%) | 3.5 | 4.2 | 4.8 | +60 bps |
| Average P/NAV (times) | 1.34 | 1.12 | 1.06 | -0.06 |
| BOJ Policy Rate (%) | -0.10 | 0.25 | 0.75 | +50 bps |
Sectoral Divergence
The interest rate sensitivity of different property sectors has created clear winners and losers within the J-REIT universe:
Table 2: J-REIT Sector Performance by Asset Type (2025)
| Sector | Market Cap (¥ bn) | Dividend Yield (%) | P/NAV | Leverage Ratio (%) | 1Y Total Return (%) |
|---|---|---|---|---|---|
| Office | 4,820 | 4.5 | 1.02 | 42.3 | -5.2 |
| Logistics | 3,150 | 4.2 | 1.15 | 44.1 | -2.8 |
| Retail | 2,430 | 5.1 | 0.95 | 43.7 | -8.5 |
| Residential | 2,180 | 4.0 | 1.12 | 41.8 | -1.5 |
| Hotel | 1,350 | 5.8 | 0.88 | 46.2 | -12.3 |
| Diversified | 770 | 4.6 | 1.03 | 43.5 | -4.1 |
| Market Average | 14,700 | 4.8 | 1.06 | 43.5 | -5.7 |
Key Observations:
- Hotel REITs underperformed most severely (-12.3% total return), as rate hikes compressed valuations while operational recovery remained uneven. Notable names include Kasumigaseki Capital and Global One REIT, which saw distribution declines due to rising borrowing costs and renovation-related downtime.
- Office REITs demonstrated relative resilience, benefiting from Tokyo’s extraordinarily tight office market (0.5% vacancy in Central 5 Wards). Rent growth of 8.2% YoY partially offset cap rate expansion.
- Logistics REITs maintained premium valuations (P/NAV 1.15x), reflecting continued demand from e-commerce and supply chain reconfiguration.
- Residential REITs proved most defensive, with the lowest volatility and a relatively stable 4.0% yield.
Leverage and Financing
The average J-REIT loan-to-value (LTV) ratio stood at 43.5% at end-2025, modestly elevated from 42.1% a year earlier. The average cost of debt rose to approximately 1.2%, up from 0.7% in 2023, compressing net interest margins. Fixed-rate debt accounted for roughly 78% of total borrowing, providing a buffer against further rate increases.
Part II: Singapore REITs (S-REITs) — Global Capital Hub Resilient
Market Structure
Singapore remains Asia’s most internationalized REIT market. As of end-2025, 41 S-REITs and property trusts were listed on the SGX, with a combined market cap of approximately SGD 88 billion (USD 65 billion). The market’s defining feature is its external management structure and global asset footprint — S-REITs collectively own properties across 20+ countries.
Table 3: S-REIT Market Key Metrics
| Metric | 2022 | 2023 | 2024 | 2025 |
|---|---|---|---|---|
| Number of Listed S-REITs | 42 | 42 | 42 | 41 |
| Market Cap (SGD bn) | 85 | 82 | 86 | 88 |
| Average Dividend Yield (%) | 5.8 | 6.2 | 6.0 | 5.9 |
| Average P/NAV (times) | 0.92 | 0.85 | 0.80 | 0.77 |
| Average Leverage (%) | 37.5 | 38.2 | 38.8 | 38.5 |
Sector Breakdown
Table 4: S-REIT Performance by Sector (2025)
| Sector | Market Cap (SGD bn) | Yield (%) | P/NAV | Leverage (%) |
|---|---|---|---|---|
| Industrial | 22.5 | 6.2 | 0.82 | 36.8 |
| Retail | 18.3 | 6.5 | 0.72 | 37.5 |
| Office | 15.8 | 5.5 | 0.68 | 38.2 |
| Hospitality | 10.2 | 6.8 | 0.75 | 39.5 |
| Healthcare | 8.5 | 5.2 | 0.85 | 35.3 |
| Diversified | 12.7 | 5.8 | 0.80 | 39.0 |
| Average/Total | 88.0 | 5.9 | 0.77 | 38.5 |
Notable Transactions:
- Hotel S-REITs actively consolidated through acquisitions, with several notable deals reshaping the hospitality REIT landscape.
- CapitaLand Ascott Trust divested a Tianjin serviced apartment property for RMB 420 million.
- CapitaLand China Trust sold a Changsha shopping mall to a China public REIT for RMB 814 million, marking a milestone in cross-border REIT asset recycling.
China Exposure
Singapore and Hong Kong REITs collectively held significant exposure to mainland China commercial properties. As of 2025:
- City distribution: Tier-1 cities (Beijing, Shanghai, Guangzhou, Shenzhen) accounted for approximately 65% of total mainland asset value held by offshore REITs.
- Sector distribution: Retail (38%), Office (35%), Industrial/Logistics (18%), Hospitality (9%).
- The trend of divesting mainland assets to C-REITs was accelerating, creating a new asset recycling channel.
Part III: Hong Kong REITs (H-REITs) — Deep Value Amid Recovery
Market Snapshot
Hong Kong’s REIT market, comprising 11 listed trusts with a combined market cap of approximately HKD 120 billion, remained the most deeply discounted REIT market in Asia. The average P/NAV of 0.35x suggested extreme value dislocation, though structural headwinds in the office sector weighed on sentiment.
Table 5: H-REIT Key Metrics
| Metric | 2022 | 2023 | 2024 | 2025 |
|---|---|---|---|---|
| Market Cap (HKD bn) | 145 | 125 | 118 | 120 |
| Average Dividend Yield (%) | 6.0 | 6.8 | 7.2 | 7.0 |
| Average P/NAV (times) | 0.48 | 0.40 | 0.37 | 0.35 |
| Gearing Ratio (%) | 28.5 | 29.2 | 30.1 | 30.8 |
Key Dynamics:
- Link REIT remained the dominant constituent, accounting for over 65% of total H-REIT market cap.
- The H-REIT sector benefited from Hong Kong’s IPO market revival — 2025 full-year IPO fundraising reached HKD 285.8 billion, ranking #1 globally, driving demand for office and commercial space.
- Office vacancy rates diverged sharply: Central district began stabilizing (single-digit vacancy for prime assets), while non-core areas (Kowloon East, Island South) faced persistent oversupply.
Cross-Market Comparison: Yield Spreads
Table 6: Asia REIT Dividend Yield vs. 10-Year Government Bond Yield (2025)
| Market | REIT Dividend Yield (%) | 10Y Bond Yield (%) | Risk Premium (bps) |
|---|---|---|---|
| Japan (J-REITs) | 4.8 | 1.52 | +328 |
| Singapore (S-REITs) | 5.9 | 3.15 | +275 |
| Hong Kong (H-REITs) | 7.0 | 3.85 | +315 |
| China (C-REITs) | 5.2* | 1.68 | +352 |
| United States (US-REITs) | 4.2 | 4.45 | -25 |
*Estimated average for infrastructure C-REITs; commercial REIT yields expected at 4.5-5.5%.
Part IV: China Public REITs — The Infrastructure-to-Commercial Pivot
Infrastructure C-REIT Market Maturation
China’s public REIT market, launched in June 2021, has rapidly scaled to become Asia’s second-largest REIT jurisdiction by number of listed products.
Table 7: C-REIT Market Growth Trajectory
| Time Point | Listed Products | Issuance Size (RMB bn) | Market Cap (RMB bn) |
|---|---|---|---|
| June 2021 (Launch) | 9 | 31.4 | 31.4 |
| Dec 2022 | 24 | 78.3 | 85.2 |
| Dec 2023 | 30 | 98.6 | 98.0 |
| Dec 2024 | 58 | 146.0 | 155.0 |
| Mar 2026 | 79 | 215.5 | 221.3 |
| Jun 2026 | 82 | 224.3 | 214.1 |
Trading and Liquidity Dynamics
A notable trend in 2025-2026 was the sustained decline in turnover velocity, reflecting the market’s evolution from speculative trading to institutional buy-and-hold:
Table 8: C-REIT Quarterly Turnover Rate (%)
| Period | Turnover Rate (%) | Institutional Ownership (%) |
|---|---|---|
| 2021 H2 | 2.8 | 78.5 |
| 2022 | 1.8 | 85.2 |
| 2023 | 1.2 | 92.1 |
| 2024 | 0.7 | 95.3 |
| 2025 Q1 | 0.5 | 96.7 |
| 2025 Q4 | 0.45 | 97.0 |
| 2026 Q1 | 0.40 | 97.2 |
Institutional investors — primarily insurance companies, securities firms, and proprietary trading desks — now hold 97.2% of C-REIT units, making it one of the most institutionally concentrated REIT markets globally.
Sector Distribution and Performance
Table 9: C-REIT Sector Breakdown (June 2026)
| Asset Type | Products | Market Cap (RMB bn) | Avg Yield (%) | Premium/Discount to NAV | YoY Price Change (%) |
|---|---|---|---|---|---|
| Toll Roads | 13 | 68.5 | 6.8 | -5.2 | +2.1 |
| Industrial Parks | 20 | 42.3 | 5.5 | -8.5 | -4.3 |
| Warehousing/Logistics | 11 | 35.8 | 5.2 | -3.1 | +1.8 |
| Clean Energy | 9 | 28.1 | 5.8 | +2.5 | +5.6 |
| Rental Housing | 9 | 18.5 | 4.5 | +8.2 | +12.3 |
| Consumer Infrastructure | 12 | 15.2 | 5.0 | +3.5 | +7.8 |
| Utilities (Water/Gas/Heating) | 2 | 3.2 | 4.8 | +1.0 | +3.2 |
| Data Centers & Others | 5 | 2.5 | 5.5 | -2.0 | N/A* |
| Total | 81 | 214.1 | 5.2 | -1.2 | +2.8 |
*New listings
Rental housing and consumer infrastructure REITs have been the standout performers, driven by defensive cash flow characteristics and strong policy tailwinds.
Part V: Commercial Real Estate C-REITs — A New Era Begins
Policy Framework: The “1+3+N” Architecture
The 2025 launch of China’s commercial real estate REIT pilot program represents the most significant structural change in Asia REIT markets since Japan’s J-REIT launch in 2001. The regulatory framework — dubbed “1+3+N” — comprises:
- “1” Core Policy: The CSRC’s Commercial Real Estate Investment Trust Pilot Announcement (2025), officially extending REITs beyond infrastructure into shopping malls, office buildings, and hotels.
- “3” Supporting Rules: Review mechanism guidelines, asset eligibility criteria, and disclosure templates issued by stock exchanges.
- “N” Implementation Guidelines: Sector-specific operational rules, taxation circulars, and local government support measures.
Key Rule Differences: Infrastructure vs. Commercial REITs
Table 10: Infrastructure C-REITs vs. Commercial REITs — Regulatory Comparison
| Dimension | Infrastructure C-REITs | Commercial Real Estate REITs |
|---|---|---|
| Review Mechanism | NDRC pre-review → CSRC registration | CSRC direct review (no NDRC pre-review) |
| Issuance Timeline | 6-8 months (average) | ~4 months (first batch) |
| Sponsor Eligibility | ≥2 completed comparable projects; no major non-compliance | ≥3 years commercial property operating experience; ≥300,000 sqm GFA under management |
| Use of Proceeds | ≥60% reinvested in new infrastructure projects | ≤30% may be used for supplementary working capital; ≥70% for new commercial property investment or debt repayment |
| Asset Scope | Toll roads, industrial parks, warehousing, clean energy, rental housing, utilities, data centers, consumer infrastructure | Shopping malls, department stores, outlets, office buildings, hotels (with restrictions on hotel proportion) |
| Operational Requirements | ≥3 years of operation; ≥3 years stable cash flow | ≥3 years of operation; ≥85% occupancy rate (12-month average) |
| Leverage Cap | 28.57% of net asset value (fund-level) | 40% of net asset value (fund-level, aligned with international norms) |
Pipeline and Issuance Momentum
Table 11: Commercial REIT Pipeline (as of May 2026)
| Developer/Sponsor | Asset Type | Estimated Size (RMB bn) | Status |
|---|---|---|---|
| China Resources Land | Shopping Malls (MixC portfolio) | 12.0-15.0 | Registered |
| CapitaLand China | Mixed (retail + office) | 8.0-10.0 | Registered |
| Longfor Group | Shopping Malls (Paradise Walk) | 6.0-8.0 | Registered |
| Vanke (Onewo) | Mixed (retail + office) | 5.0-7.0 | Registered |
| Sun Hung Kai Properties | Mixed | 4.0-6.0 | Pre-application |
| Henderson Land | Mixed | 3.0-5.0 | Pre-application |
| Seazen Holdings | Shopping Malls | 3.0-4.0 | Pre-application |
| Dalian Wanda | Shopping Malls | 10.0-15.0 | Pre-application |
| Total (20+ filings) | Mixed | ~700 | Cumulative as of mid-2026 |
The first batch of 4 commercial REITs completed registration and obtained approval, with an average issuance cycle of approximately 4 months — significantly faster than the infrastructure REIT pipeline. Within just six months of the pilot launch, cumulative filings reached nearly RMB 70 billion, suggesting that annual commercial REIT issuance could quickly scale to RMB 100+ billion.
Part VI: Global Office Market Analysis — A Tale of Four Quadrants
Cushman & Wakefield’s analysis categorizes 11 major global office markets into four distinct quadrants based on rent and vacancy rate profiles.
Table 12: Global Prime Office Market Metrics (Q4 2025)
| City | Stock (mn sqm) | Rent (RMB/sq m/mo) | Vacancy Rate (%) | Dominant Tenant Sector |
|---|---|---|---|---|
| New York Manhattan | 38.8 | 521.5 | 21.1 | Financial Services |
| London | 27.7 | 999.4 | 5.6 | Financial Services, Professional Services |
| Los Angeles | 19.7 | 292.8 | 23.4 | Insurance, Entertainment, Financial |
| Tokyo Central 5 Wards | 10.1 | 542.2 | 0.5 | TMT, Manufacturing |
| Singapore CBD | 3.1 | 658.7 | 4.4 | Financial & Insurance, ICT, Professional Services |
| Sydney CBD | 3.6 | 413.8 | 14.1 | Professional Services |
| Hong Kong | 6.9 | 420.9 | 20.3 | Financial Services, Professional Services |
| Beijing | 13.7 | 205.6 | 15.9 | TMT, Professional Services, Financial |
| Shanghai | 17.9 | 201.4 | 23.4 | Professional Services, Financial, TMT |
| Guangzhou | 7.1 | 116.3 | 20.7 | Financial, Consumer Manufacturing, Culture/Entertainment |
| Shenzhen | 9.1 | 149.4 | 29.4 | TMT, Export Trade, Logistics/Supply Chain |
Four-Quadrant Classification
Quadrant I — High Rent, High Vacancy (Divergent Markets):
- New York Manhattan & Hong Kong: Premium asset valuations persist despite elevated vacancies, reflecting deep structural bifurcation between trophy and commodity office assets. Hong Kong’s Central district is showing early recovery signs (Q1 2026 overall rents +2.4% QoQ, Central +5.5%), but non-core areas continue to suffer.
Quadrant II — High Rent, Low Vacancy (Scarcity Markets):
- London, Singapore, Tokyo, Sydney: Core assets exhibit exceptional scarcity value. Tokyo’s 0.5% vacancy is historically unprecedented, driving 8.2% YoY rent growth. Singapore CBD rents rose 2.4% YoY to RMB 658.7/sq m/month with only 60,000 sqm of new supply in 2025. London’s 5.6% vacancy and RMB 999.4 rent demonstrate the enduring premium of global gateway cities.
Quadrant III — Low Rent, Low Vacancy (Resilient Recovery):
- Beijing: The sole market in this quadrant. Vacancy dropped significantly from 18.3% (Q4 2024) to 15.9% (Q4 2025), while rents stabilized at RMB 205.6/sq m/month after a multi-year correction from RMB 321.5 in 2022.
Quadrant IV — Low Rent, High Vacancy (Pressure Markets):
- Shanghai, Shenzhen, Guangzhou, Los Angeles: Oversupply and structural demand shifts create persistent pressure. Shenzhen vacancy at 29.4% with rents down 11.7% YoY; Guangzhou vacancy still rising despite rent compression of 30.2% from 2022 peak.
Capitalization Rate Analysis
Table 13: Office Cap Rates by City (Q4 2025)
| City | Cap Rate (%) | 4-Year Change (bps) | 10Y Bond Yield (%) | Risk Premium (bps) |
|---|---|---|---|---|
| Hong Kong | 3.3 | +40 | 3.85 | -55 |
| Singapore | 3.7 | +50 | 3.15 | +55 |
| Tokyo | 4.3 | +70 | 1.52 | +278 |
| Beijing | 5.5 | +120 | 1.68 | +382 |
| Shanghai | 5.7 | +140 | 1.68 | +402 |
| Shenzhen | 5.75 | +130 | 1.68 | +407 |
| Guangzhou | 5.9 | +160 | 1.68 | +422 |
| London | 6.0 | +30 | 4.60 | +140 |
| Sydney | 6.1 | +40 | 4.55 | +155 |
| New York Manhattan | 6.5 | +180 | 4.45 | +205 |
| Los Angeles | 7.2 | +220 | 4.45 | +275 |
Key Insight: Chinese Tier-1 cities now offer the widest risk premiums globally (380-420 bps above sovereign bonds), driven by the combination of declining risk-free rates and rising cap rates — a rare divergence that reflects investor concerns about rent sustainability but also presents potential deep-value entry points for long-term capital.
Transaction Volume Analysis
Table 14: Major City Office Transaction Volume (2025)
| City | Transaction Volume (RMB bn) | YoY Change (%) | Dominant Buyer Type |
|---|---|---|---|
| Tokyo | 100.8 | +Record High | International (37.2%) |
| New York Manhattan | 80.0+ | +5-Year High | Local Institutions & Individuals (69%) |
| London | 77.8 | +40.7 | International (50%+) |
| Los Angeles | 43.3 | +24.1 | Individual Buyers (72.3%) |
| Shanghai | 42.4 | -40.0 | Institution (cautious, 79% sub-RMB 50M deals) |
| Sydney | 36.9 | +50.0 | International (46%) |
| Shenzhen | 29.5 | +23.9 | Self-use Buyers (government/tech) |
| Singapore | 22.8 | +Recovery | Local REITs (62.7%) |
| Hong Kong | 20.6 | +30.3 | Self-use Buyers (75%, 10-year high) |
| Beijing | 15.0 | -5-Year Low | Self-use Buyers (dominant) |
| Guangzhou | 5.6 | -61.8 | Private/Individual (50%), Distressed Auctions |
Part VII: ESG — From Voluntary Narrative to Mandatory Disclosure
Regulatory Landscape Across Asia
ESG disclosure requirements across Asia are converging rapidly toward mandatory, ISSB-aligned frameworks. The report maps six major markets:
Table 15: Asia ESG Disclosure Mandates — Implementation Timeline
| Market | Key Regulation | Mandatory Scope | Scope 3 Timeline | Assurance |
|---|---|---|---|---|
| Mainland China | SSE/SZSE Self-Regulatory Guidelines + MOF Climate Standard | A-share index constituents, A+H shares (first batch Apr 2026) | Not yet mandated | MOF Standard 6101 (2026) provides framework |
| Hong Kong | ESG Reporting Code (2025 Rev) + CG Code | All HKEX issuers | Large-cap mandatory from 2026 | Encouraged |
| Singapore | SGX Climate Disclosure (ISSB-based) | All listed + large non-listed (≥SGD 1bn revenue) | From FY2026 | Phased from FY2027 |
| Japan | JSS Standards (SSBJ, Mar 2025) | Prime Market (phased by market cap ≥¥1tn) | Under consultation | TB |
| South Korea | K-SSRS Roadmap (FSC 2025) | KOSPI ≥KRW 2tn assets from 2026-27 | TB | TB |
| Taiwan | Sustainability Report Operating Rules (2025 Rev) | All 1,869 listed/OTC companies (Aug 2025 deadline) | TB | TB |
C-REIT ESG Disclosure Status
Table 16: C-REIT ESG Report Disclosure Rate by Asset Type (as of May 2026)
| Asset Type | Total Listed | ESG Reports Published | Disclosure Rate (%) | 2026 Reports Issued |
|---|---|---|---|---|
| Rental Housing | 9 | 6 | 66.7 | 5 |
| Consumer Infrastructure | 12 | 5 | 41.7 | 5 |
| Clean Energy | 9 | 4 | 44.4 | 2 |
| Utilities (Water/Gas/Heating) | 2 | 1 | 50.0 | 1 |
| Industrial Parks | 20 | 4 | 20.0 | 3 |
| Warehousing/Logistics | 11 | 2 | 18.2 | 0 |
| Toll Roads | 13 | 2 | 15.4 | 2 |
| Data Centers/Others | 5 | 0 | 0.0 | 0 |
| Total | 81 | 24 | 29.6 | 18 |
China AMC (华夏基金) made history in March 2026 by publishing 11 REIT ESG reports simultaneously — the largest single-manager ESG disclosure event in the C-REIT market to date.
ESG Impact Channel on Asset Value
The report quantifies ESG’s impact on real estate asset pricing through three channels:
- Environmental: Green-certified buildings in Beijing and Shanghai command 5-10% higher per-square-meter valuations than non-certified comparables, driven by lower operating costs, reduced vacancy risk, and future-proofing premiums.
- Social: For operating-property REITs, tenant satisfaction, renewal rates, and community engagement metrics directly correlate with NOI stability. Consumer REITs (e.g., China Resources MixC) now prominently disclose consumer experience scores and green lease adoption rates.
- Governance: GRESB ratings, green financing terms, and disclosure quality increasingly determine access to institutional capital and cost of debt.
Case Studies
- Keppel DC REIT: Achieved ~12% PUE improvement across core assets via AI-driven predictive cooling. Signed 4 VPPA contracts delivering 86,280 MWh of green electricity. Committed to 50% Scope 1/2 emission reduction by 2035 (vs. 2025 baseline).
- China Merchants Shekou Rental Housing REIT: 100% green lease convention adoption at both Taiziwan and Linxia projects. Integrated fabric recycling, waste sorting education, and “Zero Carbon Forest” community events.
- China Resources MixC Consumer REIT: Qingdao MixC achieved China’s first WELL HSR certification for a shopping mall. Scope 1+2 GHG intensity down 42.8% vs. 2019 baseline.
Part VIII: Strategic Outlook — Five Themes for 2026-2028
1. C-REIT Commercial Era: RMB Trillion Pipeline Unlocking
With 20+ filings totaling ~RMB 700 billion in six months, China’s commercial REIT market is poised to become a top-three global REIT jurisdiction within three years. The “1+3+N” framework is deliberately designed for speed: 4-month issuance cycles, CSRC direct review (bypassing NDRC), and 40% leverage caps aligned with international norms.
2. Japan: The Rate Normalization Stress Test Continues
J-REITs face a delicate balancing act in 2026-2027. While Tokyo’s office market fundamentals are exceptionally strong (0.5% vacancy, 8.2% rent growth), further BOJ rate hikes could push average borrowing costs above 1.5%, compressing distributions. Fixed-rate debt coverage (78%) provides meaningful but incomplete protection. The key variable is whether rent growth in Tokyo’s hyper-tight market can outpace cap rate expansion.
3. “Diversified” as the New Default for C-REITs
Only 6 of 20+ commercial REIT filings are diversified/multi-asset products (30%), versus 47% for J-REITs. The report argues strongly that “comprehensive” REITs with multi-sector exposure will be the long-term winners, smoothing cyclical volatility and enabling sponsor-level consolidation — following the proven trajectory of CapitaLand, Mapletree, and Japanese diversified REITs.
4. Office Market Bifurcation: Green + Prime = Premium
The global office market is not experiencing a uniform downturn — it is bifurcating. Core, green-certified, well-located assets in Tokyo, Singapore, and London command scarcity premiums (vacancy <5%), while non-core, commodity-grade offices face structural obsolescence. This bifurcation has direct implications for REIT portfolio construction: the quality premium is widening globally.
5. ESG as a Capital Markets Screening Tool
With ISSB-aligned mandates rolling out across all six major Asian markets between 2025-2028, ESG disclosure is transitioning from “nice-to-have” to “cost-of-capital determinant.” GRESB participation has reached 99.7% market cap coverage for J-REITs. Singapore’s iEdge-UOB APAC Yield Focus Green REIT Index and GRESB-linked loan products (e.g., Bank of Beijing’s “Sustainable Real Estate Support Loan” offering up to 20bps rate reduction) are early indicators of how ESG performance will directly price into REIT capital stacks.